Grabplot: Interactive Plotting with matplotlib
June 1, 2016
Grabplot is an interactive tool for plotting simple shapes on the integer lattices using a matplotlib backend. The resulting figure can be saved as a .poly file and fed to Triangulation softwares such as Triangle.
Presentation
| Download .ipynb notebook | Download image.png |
The interactive matplotlib figure has the following functionalities:
- Clicking anywhere on the figure adds a point to the current contour and maps it to the closest point in the integer lattice.
- Pressing s saves the current graph.
- Pressing x removes the latest point from the graph.
- pressing h joins the current contour and starts a new polygon (filled).
- Pressing n joins the current contour and starts a new polygon (hole).
- Pressing Enter saves the .poly file, closes the figure and displays the result.
Implementation
LineTracker
The core module of GrabPlot is an interactive line tracker object that keeps track of the keyboard events and point clicks on the figure.
class LineTracker:
    def __init__(self, accept_thresh=0.5):
        self.lines = []                    # Matplotlib lines objects
        self.coords = [[[], [], False]]    # (x, y, hole)
        self.accept_thresh = accept_thresh
On a click event, the tracker first matches the target the closest point on the integer lattice if the click event occurs close enough in space (see accept_thresh parameter). It then adds the correct point to the cumulative list of vertices.
def accept_point(self, x, y):
return ((abs(x - round(x)) < self.accept_thresh) and
        (abs(y - round(y)) < self.accept_thresh))

def __call__(self, event):
"""Mouse click event routine."""
x, y = event.xdata, event.ydata
if (not event.inaxes in self.fig.axes) or (not self.accept_point(x, y)):
    return

x, y = round(x), round(y)
self.coords[-1][0].append(x)
self.coords[-1][1].append(y)
## If starting point of a new line
if len(self.coords[-1][0]) == 1:
    self.lines.append(plt.plot([x], [y]))
# Otherwise
else:
    self.lines[-1].set_data(self.coords[-1][0], self.coords[-1][1])
The second type of event are key press. In that case, we first need to identify which key has been pressed and updates the graphic display accordingly. In particular, we incorporate a feature to remove the latest drawn point for the figure and to create a new contour (either as a hull (i.e., filled area) or as a hole).
def press_handler(self, event):
## Remove a point from the graph
if event.key == 'x':
    if len(self.coords[-1][0]) > 0:
        self.coords[-1][0] = self.coords[-1][0][:-1]
        self.coords[-1][1] = self.coords[-1][1][:-1]
	self.lines[-1].set_data(self.coords[-1][0], self.coords[-1][1])

## Add a new line (hole or hull)
elif event.key == 'h' or event.key == 'n' or event.key == 'enter':
    # Close previous line
    if len(self.coords) and
       ((self.coords[-1][0][-1], self.coords[-1][1][-1]) !=
        (self.coords[-1][0][0], self.coords[-1][1][0])):

        self.coords[-1][0].append(self.coords[-1][0][0])
        self.coords[-1][1].append(self.coords[-1][1][0])
        self.lines[-1].set_data(self.coords[-1][0], self.coords[-1][1])

    # Add new line
    if event.key == 'h' or event.key == 'n':
        self.coords.append([[], [], True if event.key == 'h' else False])
Output to .poly file
We then write an I/O function to output the given shape as a .poly file. A .poly file defines the vertices of the shape (newline separated), then the filled contours of the shape (as a list of points) and finally the holes in the shape , again as a list of point. In particular, this file format can be used as input format for Triangle software for meshing or triangulation.
def output_poly(self):
    # Hull coordinates
    point_indices = {}
    with open(self.output_file, "w") as f:
        pts, segs, holes = [], [], []
        for xs, ys, hole in self.coords:

            # Point coordinates
            ind_start = len(point_indices)
            for x, y in zip(xs, ys):
                try:
                    point_indices[(x, y)]
                except KeyError:
                    pts.append("%d %s %s" % (len(point_indices), x, y))
                    point_indices[(x, y)] = True

            # Segments
            ind_end = len(point_indices)
            segs.extend(["%d %d %d" % (
	    		 p, p, p + 1 if p < ind_end - 1 else ind_start)
                         for p in range(ind_start, ind_end)])
            # Holes
            if hole:
                holes.append("%d %s %s" % (len(holes) + 1, float(sum(xs)) /
                                           len(xs), float(sum(ys)) / len(ys)))

        # Write
        f.write("%d 2 0 0\n" % len(point_indices))
        f.write("\n".join(pts))
        f.write("\n%s 0\n" % len(segs))
        f.write("\n".join(segs))
        f.write("\n%d\n" % len(holes))
        f.write("\n".join(holes))
Demo
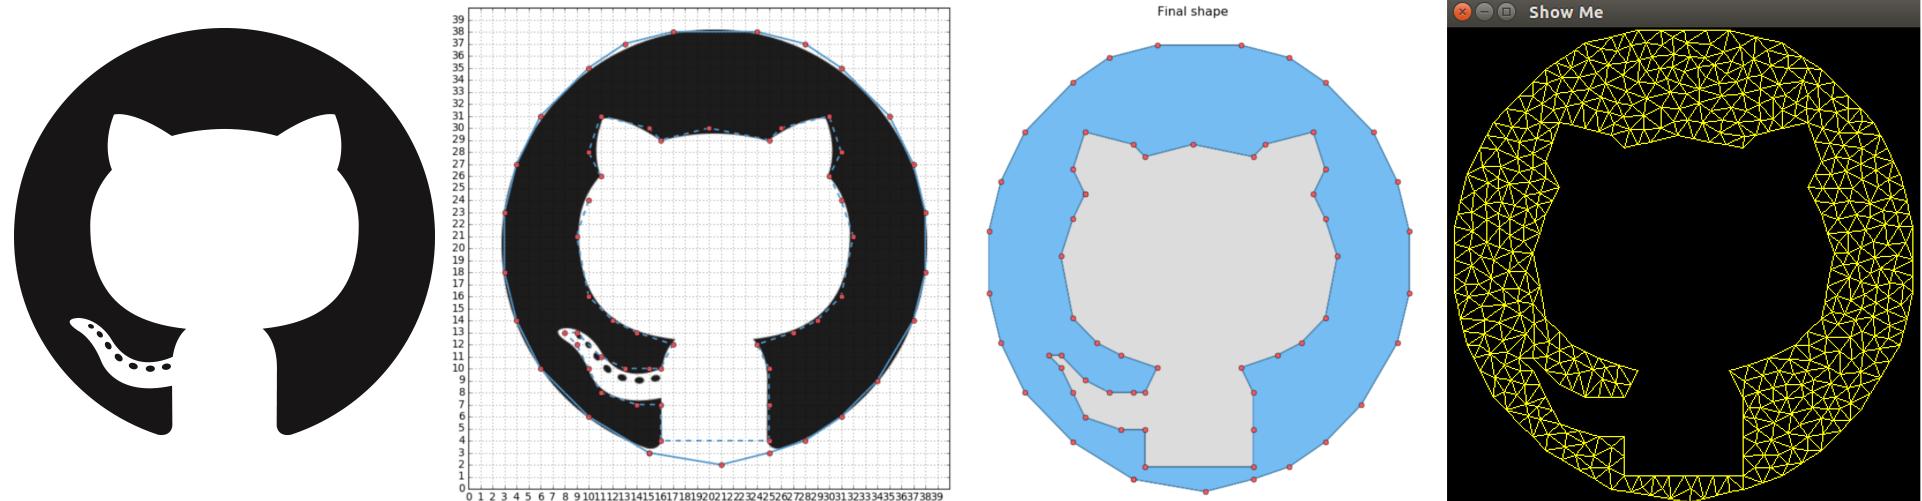
Here is the minimal working example from the introduction, which incorporates an additional background image that can be used to trace a drawing for instance.
title = "demo"
window_size = 40
background = "image.png"
output_file = "%s.poly" % title

# Create figure
fig = plt.figure(num='Grabplot - %s' % title, figsize=(10, 10))
ax = fig.add_subplot(111)
# Set window size and grid
ax.set_xticks(range(0, window_size, 1))
ax.set_yticks(range(0, window_size, 1))
plt.xlim([0, window_size])
plt.ylim([0, window_size])

if background is not None:
    from scipy.misc import imread
    plt.imshow(imread(background), zorder=0,
               extent=[0., window_size, 0, window_size])
plt.grid()

# Start plotting
graph = LineTracker(fig, output_file=output_file)
plt.show()
After plotting and closing the lines, I obtain the following rendition of the Github logo:

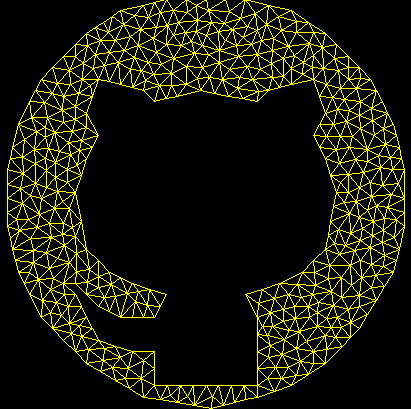
Finally applying the triangle software on the output .poly file yields the following triangulation of the generated vertices:
triangle/triangle -p -g -q25 -a1 demo
triangle/showme demo.1