Wonderwheel
December 2, 2017
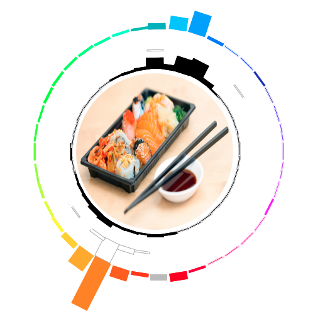
Wonderwheel is a small data visualization project for representing images color distributions. More specifically, an image is represented as three separate hue histograms for visually black pixels, visually white pixel, and the rest (perceived color information). Finally, I generate the histogram at different stages of blurriness of the image (in decreasing order) to obtain an animation, displayed with pure HTML/CSS.
Computing the histograms
The first step is to extract black, white and color pixels from the image. I first map the input image to the HSV (Hue Saturation Value) domain.
hue, sat, val = np.split(colors.rgb_to_hsv(image / 255.), 3, axis=-1)I then extract black (resp. white) pixels as pixels whose value is below (resp. above) a certain threshold
black_values = np.where(val < black_value_threshold)

hue_bins = np.linspace(0.0, 1.0, num_bins + 1, endpoint=True)
mask = sat[black_values]
black_hist, _ = np.histogram(hue, bins=hue_bins, weights=mask)
black_hist[np.isnan(black_hist)] = 0.
The remaining pixels will be used to compute the hue histograms. Each hue is additionally weighted by its saturation, so that low saturation colors, i.e. gray. get smaller weights, and an originality factor, which is defined as how far the color is from the average hue in the image.
hue[white_values] = -1
hue[black_values] = -1
weights = sat**sat_weight * np.abs(hue - np.mean(hue[hue >= 0]))
hue_hist, _ = np.histogram(hue, bins=hue_bins, weights=weights)
And the color of the histogram bar should take into account the average saturation and value for this specific hue in the image.
data['colors'] = []
for i, bin_center in enumerate(hue_bins):
index = np.where((hue > bin_center  - bins_offset) &
                 (hue < bin_center + bins_offset))
color = colorsys.hsv_to_rgb(bin_center,
			    np.mean(sat[index]),
			    np.mean(val[index]))
data['colors'].append(color)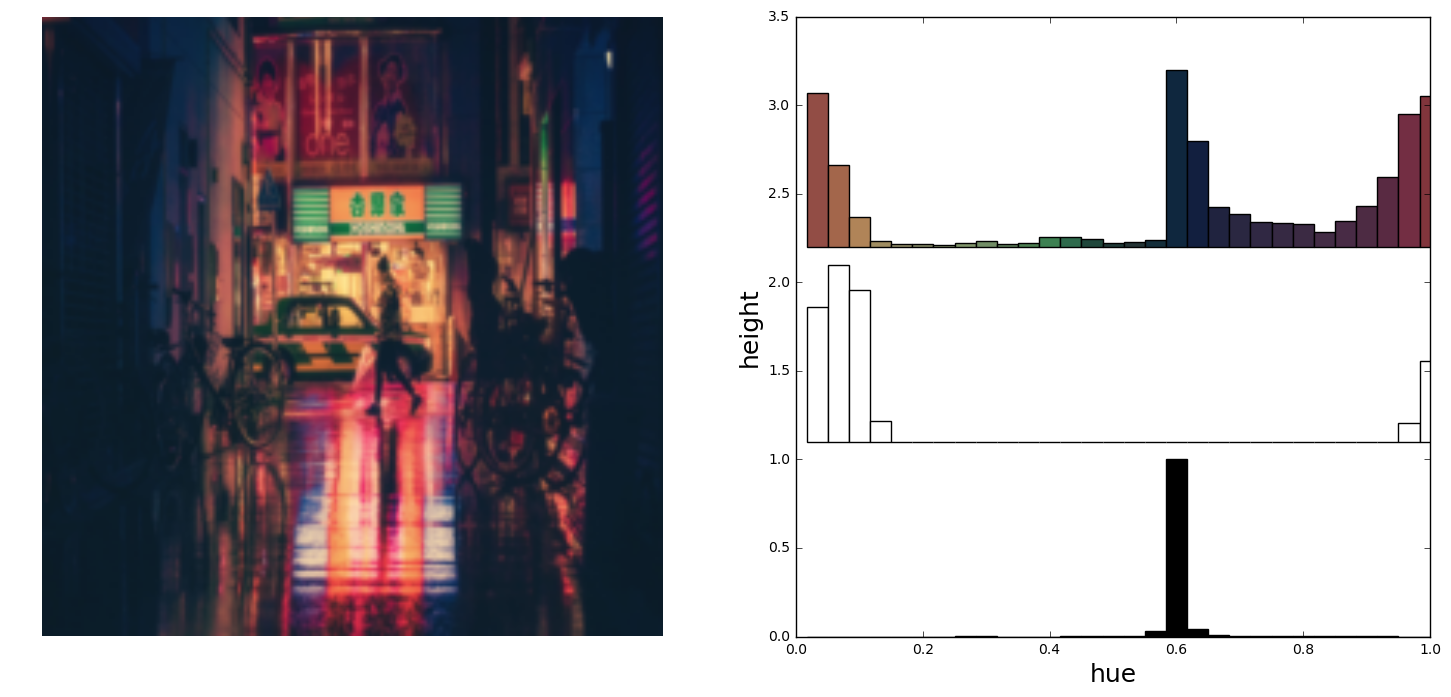
Visualization
Finally, I added a small animation component for the visualization.
First I generate a color histogram for a given image at different stage of blurriness (Gaussian filter with decreasing variance); The intuition is that the most important or salient colors will be present at a high-level while details will start appearing at fine-grained resolution.
resolutions = np.linspace(40., 0., num_resolutions, endpoint=True)
for r in resolutions:
img = ndimage.gaussian_filter(image, sigma=r)
aux = create_equalizer(img, num_bins=num_bins)
data = np.concatenate([data, aux])
And finally, the animation is created by representing each bar as a rectangular div with transition animation.
# Define bar template
bar_template = """
#{name} {
left: {pos_left}px;
top: {pos_top}px;
background-color: rgb({r}, {g}, {b});
-webkit-animation: {name}_anim {duration}s ease-out infinite ;
animation: {name}_anim {duration}s ease-out infinite;
-ms-transform: rotate({rot}deg); /* IE 9 */
-webkit-transform: rotate({rot}deg); /* Safari */
transform: rotate({rot}deg);
-webkit-transform-origin: 50% 0%;
-moz-transform-origin: 50% 0%;
-o-transform-origin: 50% 0%;
transform-origin: 50% 0%;
border: {border_width}px solid {border_color};
}
"""

# Define bar animation
def write_anim(name, heights, colors=None):
assert len(times) == len(heights)
template = ""
start = 'from'
if colors is None:
    for i in range(len(times)):
        template += "%d%% {height: %dpx;}\n" % (times[i], int(heights[i]))
else:
    for i in range(len(times)):
        template += "%d%% {height: %dpx; background:rgb(%d, %d, %d)}\n" % (
            times[i], int(heights[i]), colors[i][0], colors[i][1], colors[i][2])
template =  """
@-webkit-keyframes
{name}_anim {
    {content}
}
""".format(name=name, content=template)
return template